
UNITED STATES
SECURITIES AND EXCHANGE COMMISSION
Washington, D.C. 20549
Form 6-K
REPORT OF FOREIGN PRIVATE ISSUER
PURSUANT TO SECTION 13a-16 OR 15d-16
UNDER THE SECURITIES EXCHANGE ACT OF 1934
For the month of August 2022
Commission File Number: 001-40277
OLINK
HOLDING AB (PUBL)
(Exact Name of Registrant as Specified in its Charter)
Uppsala
Science Park
SE-751 83
Uppsala, Sweden
(Address of principal executive offices)
Indicate by check mark whether the registrant files or will file annual reports under cover of Form 20-F or Form 40-F.
| Form 20-F x | Form 40-F ¨ |
Indicate by check mark if the registrant is submitting the Form 6-K in paper as permitted by Regulation S-T Rule 101(b)(1): ¨
Indicate by check mark if the registrant is submitting the Form 6-K in paper as permitted by Regulation S-T Rule 101(b)(7): ¨
On August 11, 2022, Olink Holding AB (publ) issued a news release announcing unaudited results for the six months ended June 30, 2022, which are further described in the Company’s Interim Report For the Six Months Ended June 30, 2022, and Presentation dated August 11, 2022, copies of which are furnished as Exhibit 99.1, 99.2 and 99.3, respectively, to this Form 6-K.
SIGNATURE
Pursuant to the requirements of the Securities Exchange Act of 1934, the registrant has duly caused this report to be signed on its behalf by the undersigned, thereunto duly authorized.
| OLINK HOLDING AB (PUBL) | ||
| By: |
/s/ Jon Heimer | |
| Name: | Jon Heimer | |
| Title: | Chief Executive Officer | |
Date: August 11, 2022
Exhibit 99.1
Olink reports second quarter 2022 financial results
UPPSALA, Sweden, August 11, 2022 (GLOBE NEWSWIRE) -- Olink Holding AB (publ) (“Olink”) (Nasdaq: OLK) today announced its unaudited financial results for the second quarter of 2022.
Highlights
| ● | Second quarter 2022 revenue totaled $27.5 million, representing year over year growth of 56% on a reported basis and 62% on a constant currency adjusted like-for-like basis |
| ● | Data released by the UK Biobank Pharma Proteomics Project (UKB-PPP) highlights the power of proteomics and the promise of Olink® Explore |
| ● | Supporting Olink’s externalization goals, second quarter total Explore customer installations reached 29, with 14 additional Signature Q100 placements |
| ● | Explore revenue of $18.5 million accounted for 67% of total second quarter revenue, with Explore Kit revenue totaling $4.4 million, or 24% of total Explore revenue |
| ● | Second quarter kits revenue and analysis services revenue represented 26% and 65% of total revenue, respectively |
| ● | Second quarter 2022 adjusted EBITDA was ($7.9) million, with a net loss of ($4.8) million; compared to second quarter 2021 adjusted EBITDA of ($6.3) million and net loss of ($10.6) million |
| ● | Reiterated full year 2022 guidance, with revenue expected to be in the range of $138 million to $145 million, representing growth of 45% - 53% |
“Olink continues to make tremendous strides as the leader in the next-generation proteomics market, broadening the use of our product platform and executing on all aspects of our strategy,” said Jon Heimer, CEO of Olink. “Publication of data incorporating Olink’s PEA technology in both the research and clinical settings continues to accelerate. In particular, the UKB-PPP's release of early results from its pioneering research was a significant landmark for next-generation proteomics and Olink, and our journey to improve human health.”
Second quarter financial results
“Olink’s performance during the second quarter and first half of 2022 was very strong, setting the stage for a robust second half of the year,” said Oskar Hjelm, CFO of Olink. "Our investment into the organization is striking the proper balance of ambitious planning and financial discipline, representing a strong foundation for a return to profitability and exceptional value creation.”
Total revenue for the second quarter of 2022 was $27.5 million, as compared to $17.7 million for the second quarter of 2021, growing 56% year over year.
Second quarter 2022 kits revenue of $7.1 million represented 26% of total revenue, increasing from the first quarter of 2022 and performing within our expectations. Kits yearly revenue growth of 42% was led by very strong performance from Target, with solid growth from Explore Kit as well.
Analysis services revenue for the second quarter of 2022 was $17.9 million, as compared to $11.8 million for the second quarter of 2021, representing 51% growth.
Other revenue was $2.5 million for the second quarter of 2022, as compared to $0.8 million for the second quarter of 2021. Other revenue growth was driven primarily by Signature Q100 instruments.
| 1 | Olink press release | Second quarter 2022 report |
By geography, revenue during the second quarter of 2022 was $12.5 million in Americas, $12.6 million in EMEA (including Sweden), and $2.4 million in China and RoW (including Japan).
Adjusted EBITDA was ($7.9) million for the second quarter of 2022, as compared to ($6.3) million for the second quarter of 2021.
Adjusted gross profit was $17.9 million in the second quarter of 2022, as compared to $12.5 million in the second quarter of 2021; and reported gross profit was $17.1 million in the second quarter of 2022, as compared to $11.9 million in the second quarter of 2021.
By segment, adjusted gross profit margin for kits was 91% for the second quarter of 2022, as compared to 90% for the second quarter of 2021; and reported gross profit margin for kits was 89% for the second quarter of 2022, as compared to 87% for the second quarter of 2021.
Second quarter 2022 adjusted gross profit margin for analysis services was 58% as compared to 64% in the second quarter of 2021; and reported gross profit margin for analysis services was 54% as compared to 60% in the second quarter of 2021. The decline in analysis services margin was driven by fulfillment of the UKB-PPP and the continued expansion of Olink’s lab capacity and associated increased personnel costs.
Second quarter 2022 adjusted gross profit margin and reported gross profit margin for Other was 45%; versus second quarter 2021 adjusted gross profit margin and reported gross profit margin of 44% and 43%, respectively.
Total operating expenses for the second quarter of 2022 were $31.7 million, as compared to $23.3 million for the second quarter of 2021. The increase was largely due to continued and accelerated investment in Olink's commercial organization, research and development, and costs as a public company.
Net loss for the second quarter of 2022 was ($4.8) million, as compared to a net loss of ($10.6) million for the second quarter of 2021. Net loss per share for the second quarter of 2022 was ($0.04) based on a weighted average number of outstanding shares of 119,101,120 as compared to a net loss per share of ($0.09) in the second quarter of 2021 based on a weighted average number of outstanding shares of 119,007,062.
2022 guidance
Olink reiterates its full year 2022 revenue guidance range of $138 million to $145 million and continues to expect revenue will be weighted toward the second half of the year and fourth quarter specifically.
Webcast and conference call details
Company management will host a conference call to discuss financial results at 8:00 am ET. Investors interested in listening to the conference call are required to register online here. A live webcast will be available in the “Events” section of the Company's website at https://investors.olink.com/investor-relations. The webcast will be archived and available for replay for at least 90 days after the event.
| 2 | Olink press release | Second quarter 2022 report |
Statement regarding use of non IFRS financial measures
We present certain non-IFRS financial measures because they are used by our management to evaluate our operating performance and formulate business plans. We believe that the use of these non-IFRS measures facilitates investors’ assessment of our operating performance. We caution readers that amounts presented in accordance with our definitions of adjusted EBITDA, adjusted gross profit, adjusted gross profit margin, adjusted gross profit margin by segment, and constant currency revenue growth, may not be the same as similar measures used by other companies. Not all companies and Wall Street analysts calculate the non-IFRS measures we use in the same manner. We compensate for these limitations by reconciling each of these non-IFRS measures to the nearest IFRS performance measure, which should be considered when evaluating our performance. We encourage you to review our financial information in its entirety and not rely on a single financial measure.
Investor contact
Jan Medina, CFA
VP Investor Relations & Capital Markets
Mobile: +1 617 802 4157
jan.medina@olink.com
Media contact
Andrea Prander
Corporate Communications Manager
Mobile: +46 768 775 275
andrea.prander@olink.com
Forward-looking statements
This press release contains forward-looking statements that are based on management’s beliefs and assumptions and on information currently available to management. All statements contained in this release other than statements of historical fact are forward-looking statements, including statements regarding our 2022 revenue outlook, our Explore externalizations, our ability to develop, commercialize and achieve market acceptance of our current and planned products and services, our research and development efforts, and other matters regarding our business strategies, use of capital, results of operations and financial position, and plans and objectives for future operations. In some cases, you can identify forward-looking statements by the words “may,” “will,” “could,” “would,” “should,” “expect,” “intend,” “plan,” “anticipate,” “believe,” “estimate,” “predict,” “project,” “potential,” “continue,” “ongoing” or the negative of these terms or other comparable terminology, although not all forward-looking statements contain these words. These statements involve risks, uncertainties and other factors that may cause actual results, levels of activity, performance, or achievements to be materially different from the information expressed or implied by these forward-looking statements. These risks, uncertainties and other factors are described under the caption "Risk Factors" in our Form 20-F (Commission file number 001-40277) and elsewhere in the documents we file with the Securities and Exchange Commission from time to time. We caution you that forward-looking statements are based on a combination of facts and factors currently known by us and our projections for the future, about which we cannot be certain. As a result, the forward-looking statements may not prove to be accurate. The forward-looking statements in this press release represent our views as of the date hereof. We undertake no obligation to update any forward-looking statements for any reason, except as required by law.
| 3 | Olink press release | Second quarter 2022 report |
About Olink
Olink Holding AB (Nasdaq: OLK) is a company dedicated to accelerating proteomics together with the scientific community, across
multiple disease areas to enable new discoveries and improve the lives of patients. Olink provides a platform of products and services
which are deployed across major biopharmaceutical companies and leading clinical and academic institutions to deepen the understanding
of real-time human biology and drive 21st century healthcare through actionable and impactful science. The Company was founded in 2016
and is well established across Europe, North America, and Asia. Olink is headquartered in Uppsala, Sweden.
INTERIM CONDENSED CONSOLIDATED STATEMENTS OF INCOME AND OTHER COMPREHENSIVE INCOME (UNAUDITED)
| Three months ended June 30, | Six months ended June 30, | |||||||||||||||||||
| Amounts in thousands of U.S. Dollars | Note | 2022 | 2021 | 2022 | 2021 | |||||||||||||||
| Revenue | 4 | $ | 27,514 | $ | 17,688 | $ | 50,191 | $ | 31,316 | |||||||||||
| Cost of goods sold | (10,444 | ) | (5,823 | ) | (19,804 | ) | (10,819 | ) | ||||||||||||
| Gross profit | 17,070 | 11,865 | 30,387 | 20,497 | ||||||||||||||||
| Selling expenses | (10,588 | ) | (6,979 | ) | (20,053 | ) | (12,683 | ) | ||||||||||||
| Administrative expenses | (13,994 | ) | (12,172 | ) | (28,393 | ) | (24,583 | ) | ||||||||||||
| Research and development expenses | (7,333 | ) | (4,990 | ) | (13,318 | ) | (9,209 | ) | ||||||||||||
| Other operating income | 239 | 868 | 567 | 763 | ||||||||||||||||
| Operating loss | (14,606 | ) | (11,408 | ) | (30,810 | ) | (25,215 | ) | ||||||||||||
| Interest, net | (125 | ) | (78 | ) | (255 | ) | (1,953 | ) | ||||||||||||
| Foreign exchange, net | 8,714 | (5,806 | ) | 10,479 | (5,501 | ) | ||||||||||||||
| Other financial expenses | - | (115 | ) | - | (1,756 | ) | ||||||||||||||
| Loss before tax | (6,017 | ) | (17,407 | ) | (20,586 | ) | (34,425 | ) | ||||||||||||
| Income tax benefit | 5 | 1,195 | 6,806 | 3,594 | 9,529 | |||||||||||||||
| Net loss for the period (Attributable to shareholders of the Parent) | $ | (4,822 | ) | $ | (10,601 | ) | $ | (16,992 | ) | $ | (24,896 | ) | ||||||||
| Basic and diluted loss per share | 9 | $ | (0.04 | ) | $ | (0.09 | ) | $ | (0.14 | ) | $ | (0.37 | ) | |||||||
| Other comprehensive (loss)/income: | ||||||||||||||||||||
| Items that may be reclassified to profit or loss: | ||||||||||||||||||||
| Exchange differences from translation of foreign operations | (41,097 | ) | 13,167 | (52,389 | ) | (7,386 | ) | |||||||||||||
| Other comprehensive (loss)/income for the period, net of tax | (41,097 | ) | 13,167 | (52,389 | ) | (7,386 | ) | |||||||||||||
| Total comprehensive (loss)/income for the period, net of tax | (45,919 | ) | 2,566 | (69,381 | ) | (32,282 | ) | |||||||||||||
| Total comprehensive (loss)/income for the period (Attributable to shareholder of the Parent) | $ | (45,919 | ) | $ | 2,566 | $ | (69,381 | ) | $ | (32,282 | ) | |||||||||
| 4 | Olink press release | Second quarter 2022 report |
INTERIM CONDENSED CONSOLIDATED BALANCE SHEET (UNAUDITED)
| Amounts in thousands of U.S. Dollars | Note |
June 30, 2022 |
December 31, 2021 | |||||||||
| ASSETS | ||||||||||||
| Non-current assets | ||||||||||||
| Intangible assets | 267,839 | 308,124 | ||||||||||
| Property, plant and equipment | 13,062 | 12,696 | ||||||||||
| Right-of-use asset | 9,413 | 8,778 | ||||||||||
| Deferred tax assets | 5 | 12,170 | 9,091 | |||||||||
| Other long-term receivables | 355 | 422 | ||||||||||
| Total non-current assets | $ | 302,839 | $ | 339,111 | ||||||||
| Current assets | ||||||||||||
| Inventories | 36,365 | 28,940 | ||||||||||
| Trade receivables | 25,047 | 42,061 | ||||||||||
| Other receivables | 5,115 | 4,094 | ||||||||||
| Prepaid expenses and accrued income | 3,977 | 7,476 | ||||||||||
| Cash at bank and in hand | 99,841 | 118,096 | ||||||||||
| Total current assets | $ | 170,345 | $ | 200,667 | ||||||||
| TOTAL ASSETS | $ | 473,184 | $ | 539,778 | ||||||||
| EQUITY | ||||||||||||
| Share capital | 6 | 30,988 | 30,964 | |||||||||
| Other contributed capital | 6 | 510,435 | 506,008 | |||||||||
| Reserves/(Deficit) | (50,688 | ) | 1,701 | |||||||||
| Accumulated losses | (79,989 | ) | (62,997 | ) | ||||||||
| Total equity attributable to shareholders of the Parent | $ | 410,746 | $ | 475,676 | ||||||||
| LIABILITIES | ||||||||||||
| Non-current liabilities | ||||||||||||
| Interest-bearing loans and borrowings | 7 | 6,903 | 5,427 | |||||||||
| Deferred tax liabilities | 5 | 23,577 | 27,092 | |||||||||
| Total non-current liabilities | $ | 30,480 | $ | 32,519 | ||||||||
| Current liabilities | ||||||||||||
| Interest-bearing loans and borrowings | 7 | 2,002 | 2,952 | |||||||||
| Accounts payable | 11,257 | 8,668 | ||||||||||
| Current tax liabilities | 816 | 314 | ||||||||||
| Other current liabilities | 10 | 17,883 | 19,649 | |||||||||
| Total current liabilities | $ | 31,958 | $ | 31,583 | ||||||||
| Total liabilities | $ | 62,438 | $ | 64,102 | ||||||||
| TOTAL EQUITY AND LIABILITIES | $ | 473,184 | $ | 539,778 | ||||||||
| 5 | Olink press release | Second quarter 2022 report |
INTERIM CONDENSED CONSOLIDATED STATEMENT OF CASH FLOWS (UNAUDITED)
| Six months ended June 30, | ||||||||||||
| Amounts in thousands of U.S. Dollars | Note | 2022 | 2021 | |||||||||
| Operating activities | ||||||||||||
| Loss before tax | $ | (20,586 | ) | $ | (34,425 | ) | ||||||
| Adjustments reconciling loss before tax to operating cash flows: | ||||||||||||
| Depreciation and amortization | 8,794 | 7,420 | ||||||||||
| Net finance expense/income | (10,224 | ) | 9,210 | |||||||||
| Loss on sale of assets | 489 | - | ||||||||||
| Share-based compensation expense | 6 | 4,172 | 300 | |||||||||
| Other | (49 | ) | - | |||||||||
| Changes in working capital: | ||||||||||||
| (Increase) in inventories | (11,007 | ) | (5,470 | ) | ||||||||
| Decrease in accounts receivable | 14,509 | 12,493 | ||||||||||
| Decrease/(Increase) in other current receivables | 2,320 | (11,300 | ) | |||||||||
| Increase/(Decrease) in trade payables | 3,413 | (113 | ) | |||||||||
| (Decrease) in other current liabilities | (190 | ) | (854 | ) | ||||||||
| Interest received | 11 | - | ||||||||||
| Interest paid | (266 | ) | (2,054 | ) | ||||||||
| Tax paid | (1,110 | ) | (1,803 | ) | ||||||||
| Cash flow used in operating activities | $ | (9,724 | ) | $ | (26,596 | ) | ||||||
| Investing activities | ||||||||||||
| Purchase of intangible assets | (868 | ) | (1,692 | ) | ||||||||
| Purchase of property, plant and equipment | (3,356 | ) | (2,546 | ) | ||||||||
| Decrease/(Increase) in other non-current financial assets | 55 | (175 | ) | |||||||||
| Cash flow used in investing activities | $ | (4,169 | ) | $ | (4,413 | ) | ||||||
| Financing activities | ||||||||||||
| Proceeds from issue of share capital | 6 | 24 | 264,706 | |||||||||
| Share issue costs | 6 | - | (19,485 | ) | ||||||||
| Proceeds from interest-bearing loans and borrowings | - | 2,312 | ||||||||||
| Repayment of interest-bearing loans and borrowings | 7 | - | (65,627 | ) | ||||||||
| Payment of principal portion of lease liability | (1,502 | ) | (1,450 | ) | ||||||||
| Cash flow (used in)/from financing activities | $ | (1,478 | ) | $ | 180,456 | |||||||
| Net cash flow during the period | (15,371 | ) | 149,447 | |||||||||
| Cash at bank and in hand at the beginning of the period | 118,096 | 8,655 | ||||||||||
| Net foreign exchange difference | (2,884 | ) | 12 | |||||||||
| Cash at bank and in hand at the end of the period | $ | 99,841 | $ | 158,114 | ||||||||
| 6 | Olink press release | Second quarter 2022 report |
Reconciliations of adjusted gross profit to gross profit, the most directly comparable IFRS measure, by segment (unaudited):
| Three months ended June 30, | Six months ended June 30, | |||||||||||||||
| Amounts in thousands of U.S. Dollars unless otherwise stated | 2022 | 2021 | 2022 | 2021 | ||||||||||||
| Kit | ||||||||||||||||
| Revenue | 7,146 | 5,025 | 11,140 | 7,866 | ||||||||||||
| Cost of goods sold | (821 | ) | (632 | ) | (1,424 | ) | (1,217 | ) | ||||||||
| Gross profit | $ | 6,325 | $ | 4,393 | $ | 9,716 | $ | 6,649 | ||||||||
| Gross profit margin | 88.5 | % | 87.4 | % | 87.2 | % | 84.5 | % | ||||||||
| Less: | ||||||||||||||||
| Depreciation charges | 136 | 145 | 268 | 254 | ||||||||||||
| Share-based compensation expenses | 27 | - | 80 | - | ||||||||||||
| Adjusted Gross Profit | $ | 6,488 | $ | 4,538 | $ | 10,064 | $ | 6,903 | ||||||||
| Adjusted Gross Profit % | 90.8 | % | 90.3 | % | 90.3 | % | 87.8 | % | ||||||||
| Service | ||||||||||||||||
| Revenue | 17,885 | 11,847 | 34,491 | 21,405 | ||||||||||||
| Cost of goods sold | (8,262 | ) | (4,725 | ) | (15,925 | ) | (8,667 | ) | ||||||||
| Gross profit | $ | 9,623 | $ | 7,122 | $ | 18,566 | $ | 12,738 | ||||||||
| Gross profit margin | 53.8 | % | 60.1 | % | 53.8 | % | 59.5 | % | ||||||||
| Less: | ||||||||||||||||
| Depreciation charges | 591 | 472 | 1,282 | 932 | ||||||||||||
| Share-based compensation expenses | 76 | - | 89 | - | ||||||||||||
| Adjusted Gross Profit | $ | 10,290 | $ | 7,594 | $ | 19,937 | $ | 13,670 | ||||||||
| Adjusted Gross Profit % | 57.5 | % | 64.1 | % | 57.8 | % | 63.9 | % | ||||||||
| Corporate / Unallocated | ||||||||||||||||
| Revenue | 2,483 | 816 | 4,560 | 2,045 | ||||||||||||
| Cost of goods sold | (1,361 | ) | (466 | ) | (2,455 | ) | (935 | ) | ||||||||
| Gross profit | $ | 1,122 | $ | 350 | $ | 2,105 | $ | 1,110 | ||||||||
| Gross profit margin | 45.2 | % | 42.9 | % | 46.2 | % | 54.3 | % | ||||||||
| Less: | ||||||||||||||||
| Depreciation charges | - | 5 | - | 15 | ||||||||||||
| Share-based compensation expenses | - | - | - | - | ||||||||||||
| Adjusted Gross Profit | $ | 1,122 | $ | 355 | $ | 2,105 | $ | 1,125 | ||||||||
| Adjusted Gross Profit % | 45.2 | % | 43.6 | % | 46.2 | % | 55.0 | % | ||||||||
| 7 | Olink press release | Second quarter 2022 report |
Reconciliation of constant currency revenue growth to revenue growth as reported under IFRS, the most directly comparable IFRS measure (unaudited):
We use the non-IFRS measure of constant currency growth, which we define as our total revenue growth from one fiscal year to the next on a constant currency exchange rate basis. We measure our constant currency revenue growth by applying the current fiscal period’s average exchange rate to the prior year fiscal period.
| Three
months ended June 30, | ||||||||
| Amounts in thousands of U.S. Dollars | 2022 | 2021 | ||||||
| Revenue | $ | 27,514 | $ | 17,688 | ||||
| Revenue growth (IFRS) | 56 | % | ||||||
| Foreign exchange impact | -6 | % | ||||||
| Constant currency revenue growth | 62 | % | ||||||
Reconciliation of consolidated adjusted gross profit to gross profit, the most directly comparable IFRS measure (unaudited):
| Three
months ended June 30 | Six months ended June 30, | |||||||||||||||
| Amounts in thousands of U.S. Dollars unless otherwise stated | 2022 | 2021 | 2022 | 2021 | ||||||||||||
| Revenue | 27,514 | 17,688 | 50,191 | $ | 31,316 | |||||||||||
| Cost of goods sold | (10,444 | ) | (5,823 | ) | (19,804 | ) | (10,819 | ) | ||||||||
| Gross Profit | $ | 17,070 | $ | 11,865 | $ | 30,387 | $ | 20,497 | ||||||||
| Gross Profit % | 62.0 | % | 67.1 | % | 60.5 | % | 65.5 | % | ||||||||
| Less: | ||||||||||||||||
| Depreciation charges | 727 | 622 | 1,550 | 1,201 | ||||||||||||
| Share-based compensation expenses | 103 | - | 169 | - | ||||||||||||
| Adjusted Gross Profit | $ | 17,900 | $ | 12,487 | $ | 32,106 | $ | 21,698 | ||||||||
| Adjusted Gross Profit % | 65.1 | % | 70.6 | % | 64.0 | % | 69.3 | % | ||||||||
Reconciliation of adjusted EBITDA to operating loss, the most directly comparable IFRS measure (unaudited):
| Three
months ended June 30, | Six months ended June 30, | |||||||||||||||
| Amounts in thousands of U.S. Dollars | 2022 | 2021 | 2022 | 2021 | ||||||||||||
| Operating (loss) | (14,606 | ) | (11,408 | ) | (30,810 | ) | (25,215 | ) | ||||||||
| Add: | ||||||||||||||||
| Amortization | 2,847 | 2,728 | 5,822 | 5,448 | ||||||||||||
| Depreciation | 1,510 | 1,029 | 2,972 | 1,972 | ||||||||||||
| EBITDA | (10,249 | ) | (7,651 | ) | (22,016 | ) | (17,795 | ) | ||||||||
| Management adjustments | 321 | 1,400 | 765 | 7,822 | ||||||||||||
| Share-based compensation | 1,992 | - | 4,190 | - | ||||||||||||
| Adjusted EBITDA | $ | (7,936 | ) | $ | (6,251 | ) | $ | (17,061 | ) | $ | (9,973 | ) | ||||
| 8 | Olink press release | Second quarter 2022 report |
Exhibit 99.2
INTERIM CONDENSED CONSOLIDATED STATEMENTS OF INCOME AND OTHER COMPREHENSIVE INCOME (UNAUDITED)
| Three months ended June 30, | Six months ended June 30, | |||||||||||||||||
| Amounts in thousands of U.S. Dollars | Note | 2022 | 2021 | 2022 | 2021 | |||||||||||||
| Revenue | 4 | $ | 27,514 | $ | 17,688 | $ | 50,191 | $ | 31,316 | |||||||||
| Cost of goods sold | (10,444 | ) | (5,823 | ) | (19,804 | ) | (10,819 | ) | ||||||||||
| Gross profit | 17,070 | 11,865 | 30,387 | 20,497 | ||||||||||||||
| Selling expenses | (10,588 | ) | (6,979 | ) | (20,053 | ) | (12,683 | ) | ||||||||||
| Administrative expenses | (13,994 | ) | (12,172 | ) | (28,393 | ) | (24,583 | ) | ||||||||||
| Research and development expenses | (7,333 | ) | (4,990 | ) | (13,318 | ) | (9,209 | ) | ||||||||||
| Other operating income | 239 | 868 | 567 | 763 | ||||||||||||||
| Operating loss | (14,606 | ) | (11,408 | ) | (30,810 | ) | (25,215 | ) | ||||||||||
| Interest, net | (125 | ) | (78 | ) | (255 | ) | (1,953 | ) | ||||||||||
| Foreign exchange, net | 8,714 | (5,806 | ) | 10,479 | (5,501 | ) | ||||||||||||
| Other financial expenses | - | (115 | ) | - | (1,756 | ) | ||||||||||||
| Loss before tax | (6,017 | ) | (17,407 | ) | (20,586 | ) | (34,425 | ) | ||||||||||
| Income tax benefit | 5 | 1,195 | 6,806 | 3,594 | 9,529 | |||||||||||||
| Net loss for the period (Attributable to shareholders of the Parent) | $ | (4,822 | ) | $ | (10,601 | ) | $ | (16,992 | ) | $ | (24,896 | ) | ||||||
| Basic and diluted loss per share | 9 | $ | (0.04 | ) | $ | (0.09 | ) | $ | (0.14 | ) | $ | (0.37 | ) | |||||
| Other comprehensive (loss)/income: | ||||||||||||||||||
| Items that may be reclassified to profit or loss: | ||||||||||||||||||
| Exchange differences from translation of foreign operations | (41,097 | ) | 13,167 | (52,389 | ) | (7,386 | ) | |||||||||||
| Other comprehensive (loss)/income for the period, net of tax | (41,097 | ) | 13,167 | (52,389 | ) | (7,386 | ) | |||||||||||
| Total comprehensive (loss)/income for the period, net of tax | $ | (45,919 | ) | $ | 2,566 | $ | (69,381 | ) | $ | (32,282 | ) | |||||||
| Total comprehensive (loss)/income for the period (Attributable to shareholder of the Parent) | $ | (45,919 | ) | $ | 2,566 | $ | (69,381 | ) | $ | (32,282 | ) | |||||||
INTERIM CONDENSED CONSOLIDATED BALANCE SHEET
| Amounts in thousands of U.S. Dollars | Note | As of June 30, 2022 (Unaudited) | As of December 31, 2021 | |||||||
| ASSETS | ||||||||||
| Non-current assets | ||||||||||
| Intangible assets | $ | 267,839 | $ | 308,124 | ||||||
| Property, plant and equipment | 13,062 | 12,696 | ||||||||
| Right-of-use asset | 9,413 | 8,778 | ||||||||
| Deferred tax assets | 5 | 12,170 | 9,091 | |||||||
| Other long-term receivables | 355 | 422 | ||||||||
| Total non-current assets | 302,839 | 339,111 | ||||||||
| Current assets | ||||||||||
| Inventories | 36,365 | 28,940 | ||||||||
| Trade receivables | 25,047 | 42,061 | ||||||||
| Other receivables | 5,115 | 4,094 | ||||||||
| Prepaid expenses and accrued income | 3,977 | 7,476 | ||||||||
| Cash at bank and in hand | 99,841 | 118,096 | ||||||||
| Total current assets | 170,345 | 200,667 | ||||||||
| TOTAL ASSETS | $ | 473,184 | $ | 539,778 | ||||||
| EQUITY | ||||||||||
| Share capital | 6 | 30,988 | 30,964 | |||||||
| Other contributed capital | 6 | 510,435 | 506,008 | |||||||
| Reserves/(Deficit) | (50,688 | ) | 1,701 | |||||||
| Accumulated losses | (79,989 | ) | (62,997 | ) | ||||||
| Total equity attributable to shareholders of the Parent | $ | 410,746 | $ | 475,676 | ||||||
| LIABILITIES | ||||||||||
| Non-current liabilities | ||||||||||
| Interest-bearing loans and borrowings | 7 | 6,903 | 5,427 | |||||||
| Deferred tax liabilities | 5 | 23,577 | 27,092 | |||||||
| Total non-current liabilities | 30,480 | $ | 32,519 | |||||||
| Current liabilities | ||||||||||
| Interest-bearing loans and borrowings | 7 | 2,002 | 2,952 | |||||||
| Accounts payable | 11,257 | 8,668 | ||||||||
| Current tax liabilities | 816 | 314 | ||||||||
| Other current liabilities | 10 | 17,883 | 19,649 | |||||||
| Total current liabilities | 31,958 | 31,583 | ||||||||
| Total liabilities | $ | 62,438 | $ | 64,102 | ||||||
| TOTAL EQUITY AND LIABILITIES | $ | 473,184 | $ | 539,778 | ||||||
INTERIM CONDENSED CONSOLIDATED STATEMENTS OF CHANGES IN EQUITY FOR THE SIX
MONTHS ENDED JUNE 30, 2022 AND JUNE 30, 2021 (UNAUDITED)
| Amounts in thousands of U.S. Dollars | Notes | Share Capital |
Other Contributed Capital |
Reserves | Accumulated Loss |
Total Equity |
||||||||||||||||
| As of December 31, 2021 | $ | 30,964 | $ | 506,008 | $ | 1,701 | $ | (62,997 | ) | $ | 475,676 | |||||||||||
| Net loss for the period | (16,992 | ) | (16,992 | ) | ||||||||||||||||||
| Other comprehensive loss for the period | (52,389 | ) | (52,389 | ) | ||||||||||||||||||
| Total comprehensive loss for the period | - | - | (52,389 | ) | (16,992 | ) | (69,381 | ) | ||||||||||||||
| New share issue, net | 6 | 24 | 24 | |||||||||||||||||||
| Share-based compensation | 6 | 4,427 | 4,427 | |||||||||||||||||||
| As of June 30, 2022 | 30,988 | 510,435 | (50,688 | ) | (79,989 | ) | 410,746 | |||||||||||||||
| Amounts in thousands of U.S. Dollars | Notes | Share Capital | Other Contributed Capital | Reserves | Accumulated Loss | Total Equity | ||||||||||||||||
| As of December 31, 2020 | $ | 27,224 | $ | 257,774 | $ | 39,360 | $ | (24,658 | ) | $ | 299,700 | |||||||||||
| Net loss for the period | - | - | - | (24,896 | ) | (24,896 | ) | |||||||||||||||
| Other comprehensive loss for the period | - | - | (7,386 | ) | - | (7,386 | ) | |||||||||||||||
| Total comprehensive loss for the period | - | - | (7,386 | ) | (24,896 | ) | (32,282 | ) | ||||||||||||||
| New share issue, net | 6 | 3,740 | 245,543 | - | - | 249,283 | ||||||||||||||||
| As of June 30, 2021 | $ | 30,964 | 503,317 | 31,974 | (49,554 | ) | 516,701 | |||||||||||||||
INTERIM CONDENSED CONSOLIDATED STATEMENT OF CASH FLOWS (UNAUDITED)
| Six Months Ended June 30, | ||||||||||
| Amounts in thousands of U.S. Dollars | Note | 2022 | 2021 | |||||||
| Operating activities | ||||||||||
| Loss before tax | $ | (20,586 | ) | $ | (34,425 | ) | ||||
| Adjustments reconciling loss before tax to operating cash flows: | ||||||||||
| Depreciation and amortization | 8,794 | 7,420 | ||||||||
| Net finance expense | (10,224 | ) | 9,210 | |||||||
| Loss on sale of assets | 489 | - | ||||||||
| Share-based compensation expense | 6 | 4,172 | 300 | |||||||
| Other | (49 | ) | - | |||||||
| Changes in working capital: | ||||||||||
| (Increase) in inventories | (11,007 | ) | (5,470 | ) | ||||||
| Decrease in accounts receivable | 14,509 | 12,493 | ||||||||
| Decrease/(Increase) in other current receivables | 2,320 | (11,300 | ) | |||||||
| Increase/(Decrease) in trade payables | 3,413 | (113 | ) | |||||||
| (Decrease) in other current liabilities | (190 | ) | (854 | ) | ||||||
| Interest received | 11 | - | ||||||||
| Interest paid | (266 | ) | (2,054 | ) | ||||||
| Tax paid | (1,110 | ) | (1,803 | ) | ||||||
| Cash flow used in operating activities | $ | (9,724 | ) | $ | (26,596 | ) | ||||
| Investing activities | ||||||||||
| Purchase of intangible assets | (868 | ) | (1,692 | ) | ||||||
| Purchase of property, plant and equipment | (3,356 | ) | (2,546 | ) | ||||||
| Decrease/(Increase) in other non-current financial assets | 55 | (175 | ) | |||||||
| Cash flow used in investing activities | $ | (4,169 | ) | $ | (4,413 | ) | ||||
| Financing activities | ||||||||||
| Proceeds from issue of share capital | 6 | 24 | 264,706 | |||||||
| Share issue costs | 6 | - | (19,485 | ) | ||||||
| Proceeds from interest-bearing loans and borrowings | - | 2,312 | ||||||||
| Repayment of interest-bearing loans and borrowings | 7 | - | (65,627 | ) | ||||||
| Payment of principal portion of lease liability | (1,502 | ) | (1,450 | ) | ||||||
| Cash flow (used in)/from financing activities | $ | (1,478 | ) | $ | 180,456 | |||||
| Net cash flow during the period | (15,371 | ) | 149,447 | |||||||
| Cash at bank and in hand at the beginning of the period | 118,096 | 8,655 | ||||||||
| Net foreign exchange difference | (2,884 | ) | 12 | |||||||
| Cash at bank and in hand at the end of the period | $ | 99,841 | $ | 158,114 | ||||||
The accompanying notes are an integral part of the interim condensed consolidated financial statements.
NOTES TO THE INTERIM CONDENSED CONSOLIDATED FINANCIAL STATEMENTS (UNAUDITED)
1. General information
On January 27, 2021, Knilo HoldCo AB was registered as a Swedish public limited company and renamed as Olink Holding AB (publ) (the “Company). The Company has ten wholly owned subsidiaries. The Company and its subsidiaries develop, produce, market and sell biotechnological products and services along with thereof related activities. The Company is located at Uppsala Science Park, Dag Hammarskjölds väg 54A, SE-752 37 UPPSALA, Sweden.
On March 29, 2021, the Company completed its initial public offering (the “Offering”) in the United States. The Company’s American Depositary Shares (“ADSs”) were approved for listing on The Nasdaq Global Market (“Nasdaq”) under the trading ticker symbol “OLK”. Trading on Nasdaq commenced at market open on March 25, 2021. The ultimate parent of the Company is Summa Equity Holding AB, Stockholm, Sweden.
The Company’s interim condensed consolidated financial statements were authorized for issue by the Board of Directors on August 10, 2022.
2. Basis of preparation and summary of significant accounting policies
2.1. Basis of preparation
The interim condensed consolidated financial statements for the three and six months ended June 30, 2022 and 2021 have been prepared in accordance with IAS 34 Interim Financial Reporting. The Company has prepared the financial statements on the basis that it will continue to operate as a going concern. The Directors consider that there are no material uncertainties that may cast doubt over this assumption and that the Company has adequate resources to continue in operational existence for the foreseeable future, and not less than 12 months from the end of the reporting period.
The interim condensed consolidated financial statements are presented in thousands of US dollars unless otherwise stated.
The interim condensed consolidated financial statements do not include all the information and disclosures required in the annual financial statements and should be read in conjunction with the Company’s annual report filed on Form 20-F as of December 31, 2021.
2.2. New standards, interpretations and amendments
The accounting policies adopted in the preparation of the interim condensed consolidated financial statements are consistent with those followed in the preparation of the Company’s annual consolidated financial statements for the year ended December 31, 2021, except for the adoption of new standards effective as of January 1, 2022. The Company has not early adopted any standard, interpretation or amendment that has been issued but is not yet effective.
Several amendments apply for the first time in 2022: Reference to the Conceptual Framework – amendments to IFRS 3, Property, Plant and Equipment - Proceeds before Intended Use– amendments to IAS 16, Onerous Contracts - Cost of Fulfilling a Contract - amendments to IAS 37 and Annual Improvements to IFRS Standards 2018-2020– amendments to IFRS 1, IFRS 9, IFRS 16, and IFRS 41. None of these amendments have a material impact on the interim condensed consolidated financial statements of the Company.
3. Significant accounting estimates and judgments
In preparing these interim condensed consolidated financial statements, the significant judgments made by management in applying the Company’s accounting policies and the key sources of estimation and uncertainty were the same as those applied to the consolidated financial statements for the year ended December 31, 2021.
The COVID-19 pandemic has adversely affected, and we expect will continue to adversely affect, elements of our business. COVID-19 has primarily disrupted the customer end of the supply chain, with some customer labs operating at reduced capacity. Our production and manufacturing facilities are located in Uppsala, Sweden and Waltham, Massachusetts and we have not to date experienced any material disruptions to our production or supply of goods. However, we increased our inventory level in 2020 and 2021 in order to operate with a higher level of inventory than we have done historically.
We are continuing to closely monitor how the pandemic and related response measures and the armed conflict between Russia and Ukraine, are affecting our business. At June 30, 2022 we concluded there was no evidence of material changes to recoverability risk of business assets, including deferred tax assets and trade receivables. Olink does not have significant sales or direct supply from Russia, Belarus, or Ukraine, though the impact from the armed conflict between Russia and Ukraine on macro-economic conditions is currently unknown and could in the future have a negative effect on our results of operations, cash flows, financial condition or growth plans. Although we have not yet detected an increase in cyberattacks or attempted cyberattacks, we continue to closely monitor our IT systems based on the general risk of potential cyberattacks by state or quasi-state actors as a result of the Russia/Ukraine conflict.
4. Segment and revenue information
4.1. Description of segments and principal activities
Operating segments are reported based on the financial information provided to the Chief Executive Officer (“CEO”). The CEO is identified as the Chief Operating Decision Maker (“CODM”) of the Company. The CODM monitors the operating results of its operating segments separately for the purpose of making decisions about resource allocation and performance assessment. Evaluation of segment performance is primarily based on revenue growth. Profit or loss is measured consistently with net profit or net loss in the interim condensed consolidated financial statements. The CODM monitors the operating segments based on revenue growth and gross profit and reports its results under two segments: Kit and Service. All other operating segments have been aggregated and are included within the Corporate / Unallocated heading.
The Company’s research and development activities, sales & administrative activities, financing (including finance costs, finance income and other income) and income taxes are managed on a corporate basis and are not allocated to operating segments. Such expenditure is included in corporate/ unallocated.
4.2. Revenue and Gross Profit
The following tables presents the Company’s key financial information by segment:
| Three months ended June 30, | Six months ended June 30, | |||||||||||||||
| 2022 | 2021 | 2022 | 2021 | |||||||||||||
| Kit | ||||||||||||||||
| Revenue | $ | 7,146 | $ | 5,025 | $ | 11,140 | $ | 7,866 | ||||||||
| Total segment revenue | 7,146 | 5,025 | 11,140 | 7,866 | ||||||||||||
| Cost of goods sold | (821 | ) | (632 | ) | (1,424 | ) | (1,217 | ) | ||||||||
| Gross profit | $ | 6,325 | $ | 4,393 | $ | 9,716 | $ | 6,649 | ||||||||
| Service | ||||||||||||||||
| Revenue | $ | 17,885 | $ | 11,847 | $ | 34,491 | $ | 21,405 | ||||||||
| Total segment revenue | 17,885 | 11,847 | 34,491 | 21,405 | ||||||||||||
| Cost of goods sold | (8,262 | ) | (4,725 | ) | (15,925 | ) | (8,667 | ) | ||||||||
| Gross profit | $ | 9,623 | $ | 7,122 | $ | 18,566 | $ | 12,738 | ||||||||
| Total segments | ||||||||||||||||
| Revenue | $ | 25,031 | $ | 16,872 | $ | 45,631 | $ | 29,271 | ||||||||
| Total segment revenue | 25,031 | 16,872 | 45,631 | 29,271 | ||||||||||||
| Cost of goods sold | (9,083 | ) | (5,357 | ) | (17,349 | ) | (9,884 | ) | ||||||||
| Gross profit | $ | 15,948 | $ | 11,515 | $ | 28,282 | $ | 19,387 | ||||||||
| Corporate / Unallocated | ||||||||||||||||
| Revenue | $ | 2,483 | $ | 816 | $ | 4,560 | $ | 2,045 | ||||||||
| Total segment revenue | 2,483 | 816 | 4,560 | 2,045 | ||||||||||||
| Cost of goods sold | (1,361 | ) | (466 | ) | (2,455 | ) | (935 | ) | ||||||||
| Gross profit | $ | 1,122 | $ | 350 | $ | 2,105 | $ | 1,110 | ||||||||
| Consolidated | ||||||||||||||||
| Revenue | $ | 27,514 | $ | 17,688 | $ | 50,191 | $ | 31,316 | ||||||||
| Total segment revenue | 27,514 | 17,688 | 50,191 | 31,316 | ||||||||||||
| Cost of goods sold | (10,444 | ) | (5,823 | ) | (19,804 | ) | (10,819 | ) | ||||||||
| Gross profit | $ | 17,070 | $ | 11,865 | $ | 30,387 | $ | 20,497 | ||||||||
4.3. Disaggregation of revenue from contracts with customers
The Company derives revenue primarily from the sales of own-produced finished goods and services in the following geographical regions:
| Corporate / | ||||||||||||||||
| For the three months ended June 30, 2022 | Kit | Service | Unallocated | Total | ||||||||||||
| Sweden | 310 | 845 | 157 | 1,312 | ||||||||||||
| Americas | 1,945 | 9,429 | 1,157 | 12,531 | ||||||||||||
| EMEA (excluding Sweden) | 3,923 | 6,881 | 457 | 11,261 | ||||||||||||
| China | 416 | 8 | 487 | 911 | ||||||||||||
| Japan | 66 | 226 | 35 | 327 | ||||||||||||
| Rest of world | 486 | 496 | 190 | 1,172 | ||||||||||||
| 7,146 | 17,885 | 2,483 | 27,514 | |||||||||||||
| Corporate / | ||||||||||||||||
| For the three months ended June 30, 2021 | Kit | Service | Unallocated | Total | ||||||||||||
| Sweden | $ | 349 | $ | 466 | $ | 133 | $ | 948 | ||||||||
| Americas | 1,405 | 6,074 | 297 | 7,776 | ||||||||||||
| EMEA (excluding Sweden) | 2,862 | 4,549 | 162 | 7,573 | ||||||||||||
| China | 365 | - | 95 | 460 | ||||||||||||
| Japan | 12 | 456 | 18 | 486 | ||||||||||||
| Rest of world | 32 | 302 | 111 | 445 | ||||||||||||
| $ | 5,025 | $ | 11,847 | $ | 816 | $ | 17,688 | |||||||||
| Corporate / | ||||||||||||||||
| For the six months ended June 30, 2022 | Kit | Service | Unallocated | Total | ||||||||||||
| Sweden | 422 | 1,111 | 329 | 1,862 | ||||||||||||
| Americas | 4,303 | 16,016 | 1,916 | 22,235 | ||||||||||||
| EMEA (excluding Sweden) | 4,801 | 14,709 | 1,329 | 20,839 | ||||||||||||
| China | 920 | 29 | 663 | 1,612 | ||||||||||||
| Japan | 129 | 1,628 | 64 | 1,821 | ||||||||||||
| Rest of world | 565 | 998 | 259 | 1,822 | ||||||||||||
| 11,140 | 34,491 | 4,560 | 50,191 | |||||||||||||
| Corporate / | ||||||||||||||||
| For the six months ended June 30, 2021 | Kit | Service | Unallocated | Total | ||||||||||||
| Sweden | $ | 676 | $ | 1,003 | $ | 586 | $ | 2,265 | ||||||||
| Americas | 3,254 | 11,399 | 515 | 15,168 | ||||||||||||
| EMEA (excluding Sweden) | 3,315 | 7,706 | 510 | 11,531 | ||||||||||||
| China | 526 | - | 159 | 685 | ||||||||||||
| Japan | 49 | 966 | 48 | 1,063 | ||||||||||||
| Rest of world | 46 | 331 | 227 | 604 | ||||||||||||
| $ | 7,866 | $ | 21,405 | $ | 2,045 | $ | 31,316 | |||||||||
4.4. Seasonality of operations
The Company experiences seasonality in revenue due to customers’ annual budget cycle. The seasonality results from several factors, including the procurement and budgeting cycles customers, especially government or grant-funded customers, whose cycles often coincide with government fiscal year ends. Similarly, biopharmaceutical customers typically have calendar year fiscal years which also result in a disproportionate amount of purchasing activity occurring during the fourth quarter. The seasonality impacts both segments; therefore, higher revenues and operating profits are usually expected in the second half of the year rather than in the first six months. This information is provided to allow for a better understanding of the results; however, management has concluded that this is not ‘highly seasonal’ in accordance with IAS 34.
5. Income tax
| Three months ended | Six months ended | |||||||||||||||
| June 30, | June 30, | |||||||||||||||
| Amounts in thousands of U.S. Dollars | 2022 | 2021 | 2022 | 2021 | ||||||||||||
| Current tax | $ | (797 | ) | $ | (112 | ) | $ | (779 | ) | $ | (132 | ) | ||||
| Deferred tax | 1,992 | 6,918 | 4,373 | 9,661 | ||||||||||||
| Income tax benefit | 1,195 | 6,806 | 3,594 | 9,529 | ||||||||||||
| Effective tax rate | 20 | % | 39 | % | 17 | % | 28 | % | ||||||||
The Company operates in multiple jurisdictions globally with significant operations outside Sweden. Accordingly, the consolidated income tax rate is a composite rate reflecting earnings and the applicable tax rates in the jurisdictions where the Company operates.
6. Share capital
| (A) | Reorganization of share structure |
On March 16, 2021, the Company’s shareholders approved the adoption of new articles of association which provided for the reorganization of existing common and preferred shares into one single share class. Pursuant to the new articles of association, each class of shares have been reorganized into one class of common shares as follows:
| • | The common shares series A have been re-designated as 56,221,500 common shares; |
| • | The common shares series B have been re-designated as 250,000 common shares; |
| • | The preferred share series A have been re-designated as one common share; and |
| • | The preferred shares series B1 have been re-designated as 200,755,561 common shares. |
Furthermore, on March 16, 2021, the Company’s shareholders resolved to conduct a reverse share split where the total number of outstanding common shares (257,227,062) was consolidated into 105,771,768 common shares.
| (B) | Initial public offering |
On March 29, 2021, the Company completed an initial public offering of 13,235,294 ADSs, representing 13,235,294 common shares, at an initial public offering price of $20.00 per share. The net proceeds from the initial public offering were $249.3 million, after deducting the underwriting discounts, net of deferred taxes, and other initial public offering costs associated with the filing.
Following the initial public offering on March 29, 2021 the Company had 119,007,062 shares outstanding.
| (C) | New share issue |
On March 29, 2022, the Company issued 91,056 shares, associated with the vesting of RSUs in the incentive award plan. Following this new share issue, the Company has 119,098,118 shares outstanding.
| (D) | Incentive award plan |
On April 7, 2022 at the Annual General Meeting, our shareholders resolved to adopt two long term incentive programs, LTI I 2022 and LTI II 2022 and simultaneously approved and made effective our Amended and Restated 2021 Incentive Award Plan (the “Plan”). The Plan amends and restates the 2021 Incentive Award Plan, which was initially adopted by the Company on March 16, 2021, and approved by the shareholders of the Company on March 16, 2021, in connection with approval by the Company’s shareholders of LTI 2021 (the “Original Plan”). The principal purpose of the Plan is to attract, retain and motivate selected employees, consultants and directors through the granting of share-based compensation awards and cash-based performance bonus awards. The company has previously filed a registration statement on Form S-8 covering 1,085,900 shares under the Original Plan and has now registered an additional 594,403 common shares under the Amended and Restated 2021 Incentive Award Plan. A total of 1,680,303 shares are available for issuance pursuant to a variety of stock-based compensation awards, including stock options, restricted stock unit awards and performance-based restricted stock unit awards; provided, however, that no more than 1,680,303 additional shares may be issued. Shares available under LTI 2021, LTI I 2022 and LTI II 2022 will, subject to the terms and conditions of the Plan, be issued when the awards under the respective program vests over a four-year period from grant date, and, in case of stock options, upon the option holder exercising the option. The expiration date on stock options awarded under the programs is five years from grant date.
In connection with the closing of the initial public offering, the Company granted options to purchase an aggregate of 620,675 common shares out of the Original Plan, of which 442,789 options were granted to certain of our executive officers and directors, in each case with an exercise price equal to 125% of the initial public offering price of $20.00. During the second quarter of 2022, 107,074 options that had been approved at the Annual General Meeting on April 07, 2022, were awarded to certain of our executive officers and directors, in each case with an exercise price of $17.39. Such options shall vest over four years, subject to the terms and conditions of the Plan. The expiration date on the options is five years from grant date.
The share-based compensation cost is calculated according to the following: Fair value per option at grant date multiplied by the number of outstanding share options multiplied by the number of days passed of the vesting period. To calculate fair value per share option at the grant date, the principles of the Black-Scholes model have been used. The expense associated with these stock options amounted to $0.5 million for the six months ended June 30, 2022 and $0.2 million for the three months ended June 30, 2022. The expense associated with these stock options amounted to $0.4 million for the three and six months ended June 30, 2021. These are recorded within selling, administrative and research and development expenses within the income statement.
A summary of stock option activity under the Company's Plan relating to awards to certain officers and directors as of June 30, 2022, and changes during the six months ended June 30, 2022, are as follows:
| Outstanding Stock Options | Weighted Average Exercise Price | |||||||
| Balance as of January 1, 2022 | 442,789 | 25.00 | ||||||
| Granted | 107,074 | 17.39 | ||||||
| Forfeited | - | - | ||||||
| Balance as of June 30, 2022 | 549,863 | 23.52 | ||||||
| Vested and exercisable as of June 30, 2022 | - | |||||||
During the third quarter of 2021, 465,225 restricted stock units (“RSUs”) that had been approved at the Annual General Meeting on March 16, 2021 were awarded to employees currently employed by Olink under the Original Plan. 352,679 RSUs were outstanding as of June 30, 2022, of which 108,071 were granted to our executive officers. During the second quarter of 2022, 570,487 RSUs that had been approved at the Annual General Meeting on April 7, 2022 were awarded to employees currently employed by Olink under the Plan. 570,487 RSUs are outstanding as of June 30, 2022, of which 112,493 RSUs were granted to our executive officers. The RSUs will vest during a four-year period; new shares will be issued when the RSU’s vest.
The expense associated with these RSUs amounted to $4.0 million for the six months ended June 30, 2022 and $1.9 million for the three months ended June 30, 2022. The expense associated with these RSUs amounted to $0 million for the six months ended June 30, 2021 and $0 million for the three months ended June 30, 2021. These are recorded within selling, administrative, research and development and cost of goods sold expenses within the income statement.
The following is a summary of the RSU activity under the Company’s plan and related information as of June 30, 2022, and changes during the six months ended June 30, 2022:
| Outstanding Restricted Stock Units | Weighted Average Grant Date Fair Value | |||||||
| Balance as of January 1, 2022 | 335,449 | 23.75 | ||||||
| Granted | 590,605 | 17.61 | ||||||
| Forfeited | (2,888 | ) | - | |||||
| Vested | (87,664 | ) | 23.75 | |||||
| Balance as of June 30, 2022 | 835,502 | 19.41 | ||||||
7. Fair values
As of June 30, 2022 and December 31, 2021, respectively, the fair values of cash at bank, accounts receivables, other receivables, accounts payable, and advance payments from customers approximate their carrying amounts largely due to the short-term maturities of these instruments. There were no loan facilities as of June 30, 2022 nor as of December 31, 2021.
8. Related-party transactions
The Company entered the following related party transaction in the period prior year:
Management Service Agreements
On March 25, 2021, the Company terminated the Summa management service agreement and concurrently paid the success fee of approximately $2.25 million in connection with the initial public offering.
The Company did not enter any related party transaction agreements in the period current year.
9. Earnings per share
Earnings per share for the Company is calculated by taking the net loss for the period divided by the weighted average of outstanding common shares during the period.
| Three months ended | Six months ended | |||||||||||||||
| June 30, | June 30, | |||||||||||||||
| 2022 | 2021 | 2022 | 2021 | |||||||||||||
| Net loss for the period | $ | (4,822 | ) | $ | (10,601 | ) | $ | (16,992 | ) | $ | (24,896 | ) | ||||
| Less accumulated preferred dividend yield | - | - | - | (4,301 | ) | |||||||||||
| Total | (4,822 | ) | (10,601 | ) | (16,992 | ) | (29,197 | ) | ||||||||
| Weighted average number of shares (thousands) | 119,101 | 119,007 | 119,054 | 79,188 | ||||||||||||
| Basic and diluted loss per share | $ | (0.04 | ) | $ | (0.09 | ) | $ | (0.14 | ) | $ | (0.37 | ) | ||||
As of June 30, 2022, the Company has the following potential common shares that can be potentially dilutive but are antidilutive as of June 30, 2022, and are therefore excluded from the weighted average number of common shares for the purpose of diluted profit/(loss) per share:
| i. | 549,863 outstanding stock options related to the Amended and Restated 2021 Incentive Award Plan (see note 6) |
| ii. | 835,502 restricted stock units related to the Amended and Restated 2021 Incentive Award Plan (see note 6) |
As of June 30, 2021, 1,085,900 common shares were available for future issuance, of which options to purchase 620,675 common shares had been granted during the period. These can potentially dilute earnings per share in the future but have not been included in the calculation of diluted earnings per share because they are antidilutive for the periods presented.
The weighted average number of shares reflect the impact of the Company’s reverse share split as discussed in Note 6 for all periods presented. The accumulated preferred dividend yield established under the Company’s Management Shareholder Agreement ceased, in accordance with this agreement, without any requirement for such accumulated preferred dividend yield to be paid out as a result of the share reorganization that took place on March 16, 2021 in anticipation of the initial public offering. The $4.3 million for June 30, 2021 represents the preferred dividend yield calculated through the March 16, 2021 share reorganization as discussed in Note 6. There is no annual cash dividend declared or payable.
10. Other current liabilities
Other current liabilities consist of the following:
| Amounts in thousands of U.S. Dollars | As of June 30, 2022 | As of December 31, 2021 | ||||||
| Salaries and wages | $ | 8,698 | $ | 6,306 | ||||
| Advance invoiced customers | 1,948 | 5,447 | ||||||
| Royalties | 1,456 | 1,233 | ||||||
| Other current liabilities | 5,781 | 6,663 | ||||||
| Total | $ | 17,883 | $ | 19,649 | ||||
11. Subsequent events
The Company performed a review of events subsequent to the balance sheet date through the date the financial statements were issued and determined that there were no such events requiring recognition or disclosure in the financial statements.
MANAGEMENT’S DISCUSSION
AND ANALYSIS OF
FINANCIAL CONDITIONS AND RESULTS OF OPERATIONS
Results of Operations
| Three months ended June 30, | Six months ended June 30, | |||||||||||||||||
| Amounts in thousands of U.S. Dollars | Note | 2022 | 2021 | 2022 | 2021 | |||||||||||||
| Revenue | 4 | $ | 27,514 | $ | 17,688 | $ | 50,191 | $ | 31,316 | |||||||||
| Cost of goods sold | (10,444 | ) | (5,823 | ) | (19,804 | ) | (10,819 | ) | ||||||||||
| Gross profit | 17,070 | 11,865 | 30,387 | 20,497 | ||||||||||||||
| Selling expenses | (10,588 | ) | (6,979 | ) | (20,053 | ) | (12,683 | ) | ||||||||||
| Administrative expenses | (13,994 | ) | (12,172 | ) | (28,393 | ) | (24,583 | ) | ||||||||||
| Research and development expenses | (7,333 | ) | (4,990 | ) | (13,318 | ) | (9,209 | ) | ||||||||||
| Other operating income | 239 | 868 | 567 | 763 | ||||||||||||||
| Operating loss | (14,606 | ) | (11,408 | ) | (30,810 | ) | (25,215 | ) | ||||||||||
| Interest, net | (125 | ) | (78 | ) | (255 | ) | (1,953 | ) | ||||||||||
| Foreign exchange, net | 8,714 | (5,806 | ) | 10,479 | (5,501 | ) | ||||||||||||
| Other financial expenses | - | (115 | ) | - | (1,756 | ) | ||||||||||||
| Loss before tax | (6,017 | ) | (17,407 | ) | (20,586 | ) | (34,425 | ) | ||||||||||
| Income tax benefit | 5 | 1,195 | 6,806 | 3,594 | 9,529 | |||||||||||||
| Net loss for the period (Attributable to shareholders of the Parent) | $ | (4,822 | ) | $ | (10,601 | ) | $ | (16,992 | ) | $ | (24,896 | ) | ||||||
| Basic and diluted loss per share | 9 | $ | (0.04 | ) | $ | (0.09 | ) | $ | (0.14 | ) | $ | (0.37 | ) | |||||
| Other comprehensive (loss)/income: | ||||||||||||||||||
| Items that may be reclassified to profit or loss: | ||||||||||||||||||
| Exchange differences from translation of foreign operations | (41,097 | ) | 13,167 | (52,389 | ) | (7,386 | ) | |||||||||||
| Other comprehensive (loss)/income for the period, net of tax | (41,097 | ) | 13,167 | (52,389 | ) | (7,386 | ||||||||||||
| Total comprehensive (loss)/income for the period, net of tax | $ | (45,919 | ) | $ | 2,566 | $ | (69,381 | ) | $ | (32,282 | ||||||||
| Total comprehensive (loss)/income for the period (Attributable to shareholder of the Parent) | $ | (45,919 | ) | $ | 2,566 | $ | (69,381 | ) | $ | (32,282 | ) | |||||||
The following analysis includes EBITDA, Adjusted EBITDA, Adjusted Gross Profit and Adjusted Gross Profit Percentage which are measures not calculated in accordance with IFRS. For more information regarding our use of these measures and reconciliations to the most directly comparable financial measures calculated in accordance with IFRS, see the section titled “Non-IFRS Reconciliations” below.
Revenue
Revenue for the three months ended June 30, 2022 was $27.5 million compared to $17.7 million for the three months ended June, 2021. The increase of $9.8 million, or 56%, was driven primarily by Explore analysis services, with the Service segment growing 51%. The Kit segment grew 42% year over year on a reported basis. The Explore platform accounted for 67% of Q2 2022 revenues.
Revenue for the six months ended June 30, 2022 was $50.2 million compared to $31.3 million for the six months ended June, 2021. The increase of $18.9 million, or 60%, was driven primarily by Explore analysis services.
Gross Profit/Gross Profit Percentage
Gross profit for the three months ended June 30, 2022 was $17.1 million compared to $11.9 million for the three months ended June, 2021. The increase of $5.2 million, or 44%, was mainly due to year over year revenue growth.
The decrease in gross profit percentage of 5% was driven primarily by the buildout of our lab capacity within analysis services.
Gross profit for the six months ended June 30, 2022 was $30.4 million compared to $20.5 million for the six months ended June 30, 2021. The increase of $9.9 million, or 48%, was driven primarily by increased year over year revenue growth in both Kit and Service segment.
Operating Expenses
Total operating expenses for the three months ended June 30, 2022 were $31.7 million compared to $23.3 million for the three months ended June, 2021. The increase of $8.4 million, or 36%, was largely due to expansion and investments in the overall Olink organization as well as costs as a public company.
Total operating expenses for the six months ended June 30, 2022 were $61.2 million compared to $45.7 million for the six months ended June 30, 2021. The increase of $15.5 million, or 34%, was largely due to costs associated with continued organizational development, especially within the commercial organization.
Segment Information
Kit Revenues
Kit revenues represented 26% of our revenues for the three months ended June 30, 2022 compared to 28% for the three months ended June, 2021 and grew 42% year over year primarily as a result of continued Explore and Target revenue growth. The Company generated an adjusted gross profit percentage of 91% on Kit revenues for the three months ended June 30, 2022 compared to 90% for the three months ended June 30, 2021. The increase in adjusted gross margin for kits was primarily due to lower manufacturing expenses.
Kit revenues represented 22% of the Company’s revenues for the six months ended June 30, 2022 compared to 25% for the six months ended June 30, 2021 and grew 42% year over year primarily as a result of both Explore and Target revenue growth. The Company generated an adjusted gross profit percentage of 90% on Kit revenues for the six months ended June 30, 2022 compared to 88% for the six months ended June 30, 2021. The increase in adjusted gross margin for kits was primarily due to lower manufacturing expenses.
Service Revenues
Service revenues represented 65% of our revenues for the three months ended June 30, 2022 compared to 67% for the three months ended June, 2021 and grew 51% year over year primarily as a result of a strong momentum in demand for the Explore service offering that was launched in June 2020.
We generated an adjusted gross profit percentage of 58% on Service revenues for the three months ended June 30, 2022 compared to 64% for the three months ended June 30, 2021. The decline in analysis services margin was driven primarily by increased investments and personnel spending required for the continued expansion of our lab capacity.
Service revenues represented 69% of our revenues for the six months ended June 30, 2022 compared to 68% for the six months ended June 30, 2021 and grew 61% year over year primarily as a result of a solid year over year growth in Explore revenues.
We generated an adjusted gross profit percentage of 58% on Service revenues for the six months ended June 30, 2022 compared to 64% for the six months ended June 30, 2021. The decrease in adjusted gross profit percentage compared to the six months ended June 30, 2021 was primarily associated with increased investments necessary to increase capacity in our service labs.
Non-IFRS Reconciliations
We present these non-IFRS financial measures because they are used by our management to evaluate our operating performance and formulate business plans. We also believe that the use of these non-IFRS measures facilitates investors’ assessment of our operating performance. We caution readers that amounts presented in accordance with our definitions of Adjusted EBITDA, Adjusted Gross Profit and Adjusted Gross Profit Percentage may not be the same as similar measures used by other companies. Not all companies and Wall Street analysts calculate the non-IFRS measures we use in the same manner. We compensate for these limitations by reconciling each of these non-IFRS measures to the nearest IFRS performance measure, which should be considered when evaluating our performance. We encourage you to review our financial information in its entirety and not rely on a single financial measure.
EBITDA and Adjusted EBITDA
We use the non-IFRS measures of EBITDA and Adjusted EBITDA. We define EBITDA as profit for the year before accounting for finance income, finance costs, tax, depreciation, and amortization of acquisition intangibles. We define Adjusted EBITDA as profit for the year before accounting for finance income, finance costs, tax, depreciation, and amortization of acquisition intangibles, further adjusted for management adjustments and share-based compensation expenses. Management adjustments generally consist of certain cash and non-cash items that we believe are not reflective of the normal course of our business. We identify and determine items to be unique based on their nature and incidence or by their significance. As a result, the composition of these items may vary from year to year.
We present Adjusted EBITDA because we believe this measure can provide useful information to investors and analysts regarding the operational results of the business, as EBITDA is a fairly common metric with which market participants are familiar.
A reconciliation of Adjusted EBITDA to operating loss, the most directly comparable IFRS measure, is set forth below:
| Three months ended | Six months ended | |||||||||||||||
| June 30, | June 30, | |||||||||||||||
| Amounts in thousands of U.S. Dollars | 2022 | 2021 | 2022 | 2021 | ||||||||||||
| Operating loss | (14,606 | ) | (11,408 | ) | (30,810 | ) | (25,215 | ) | ||||||||
| Add: | ||||||||||||||||
| Amortization | 2,847 | 2,728 | 5,822 | 5,448 | ||||||||||||
| Depreciation | 1,510 | 1,029 | 2,972 | 1,972 | ||||||||||||
| EBITDA | (10,249 | ) | (7,651 | ) | (22,016 | ) | (17,795 | ) | ||||||||
| Management Adjustments | 321 | 1,400 | 765 | 7,822 | ||||||||||||
| Share-based compensation expenses | 1,992 | - | 4,190 | - | ||||||||||||
| Adjusted EBITDA | (7,936 | ) | (6,251 | ) | (17,061 | ) | (9,973 | ) | ||||||||
Management adjustments for the three months ended June 30, 2022 amounted to $0.3 million and primarily includes costs related to the Nasdaq listing. Management adjustments for the three months ended June, 2021 amounted to $1.4 million of costs associated with the initial public offering. Adjusted EBITDA for the three months ended June 30, 2022, includes an add back of $2.0 million of share-based compensation expenses associated with our Amended and Restated 2021 Incentive Award Plan.
Management adjustments for the six months ended June 30, 2022 amounted to $0.8 million and mainly refers to costs related to the Nasdaq listing. Management adjustments for the six months ended June 30, 2021 amounted to $7.8 million of costs associated with the initial and secondary public offerings. Adjusted EBITDA for the six months ended June 30, 2022, includes an add back of $4.2 million of share-based compensation expenses associated with our Amended and Restated 2021 Incentive Award Plan.
Adjusted Gross Profit, including Adjusted Gross Profit Percentage
We use the non-IFRS measure of Adjusted Gross Profit, including Adjusted Gross Profit Percentage. We define Adjusted Gross Profit as revenue less cost of goods sold, which is then adjusted to remove the impact of depreciation and the impact of material transactions or events that we believe are not indicative of our core operating performance, such as share-based compensation expenses.
We believe that Adjusted Gross Profit, including Adjusted Gross Profit Percentage, provides important information to management and to investors regarding our core profit margin on sales. These are primary profit or loss measures we use to make resource allocation decisions and evaluate segment performance. Adjusted gross profit assists management in comparing the segment performance on a consistent basis for purposes of business decision-making by removing the impact of certain items we believe do not directly reflect our core operations and, therefore, are not included in measuring segment performance.
Reconciliations of Adjusted Gross Profit to gross profit, the most directly comparable IFRS measure, are set forth below:
| Three months ended | Six months ended | |||||||||||||||
| June 30, | June 30, | |||||||||||||||
| Amounts in thousands of U.S. Dollars, unless otherwise stated | 2022 | 2021 | 2022 | 2021 | ||||||||||||
| Revenue | $ | 27,514 | $ | 17,688 | $ | 50,191 | $ | 31,316 | ||||||||
| Cost of goods sold | (10,444 | ) | (5,823 | ) | (19,804 | ) | (10,819 | ) | ||||||||
| Gross Profit | 17,070 | 11,865 | 30,387 | 20,497 | ||||||||||||
| Gross Profit % | 62.0 | % | 67.1 | % | 60.5 | % | 65.5 | % | ||||||||
| Less: | ||||||||||||||||
| Depreciation charges | 727 | 622 | 1,550 | 1,201 | ||||||||||||
| Share-based compensation expenses | 103 | - | 169 | - | ||||||||||||
| Adjusted Gross Profit | 17,900 | 12,487 | 32,106 | 21,698 | ||||||||||||
| Adjusted Gross Profit % | 65.1 | % | 70.6 | % | 64.0 | % | 69.3 | % | ||||||||
Adjusted gross profit percentage for the three months ended June 30, 2022 was 65.1% compared to an adjusted gross profit percentage of 70.6% for the three months ended June, 2021. Adjusted gross profit for the three months ended June 30, 2022 and for the three months ended June, 2021 consists of $0.7 and $0.6 million, respectively, related to depreciation charges and $0.1 and $0 million respectively related to share-based compensation expenses.
Adjusted gross profit percentage for the six months ended June 30, 2022 was 64% compared to an adjusted gross profit percentage of 69.3% for the six months ended June 30, 2021. Adjusted gross profit for the six months ended June 30, 2022 and for the six months ended June, 2021 consists of $1.6 and $1.2 million, respectively, related to depreciation charges and $0.2 million and $0 million, respectively, related to share-based compensation expenses.
Reconciliation of adjusted gross profit to gross profit, the most comparable IFRS measure, by segment (unaudited):
| Three months ended June 30 |
Six months ended June 30, |
|||||||||||||||
| Amounts in thousands of U.S. Dollars unless otherwise stated | 2022 | 2021 | 2022 | 2021 | ||||||||||||
| Kit | ||||||||||||||||
| Revenue | 7,146 | 5,025 | 11,140 | 7,866 | ||||||||||||
| Cost of goods sold | (821 | ) | (632 | ) | (1,424 | ) | (1,217 | ) | ||||||||
| Gross profit | $ | 6,325 | $ | 4,393 | $ | 9,716 | $ | 6,649 | ||||||||
| Gross profit margin | 88.5 | % | 87.4 | % | 87.2 | % | 84.5 | % | ||||||||
| Less: | ||||||||||||||||
| Depreciation charges | 136 | 145 | 268 | 254 | ||||||||||||
| Share-based compensation expenses | 27 | - | 80 | - | ||||||||||||
| Adjusted Gross Profit | $ | 6,488 | $ | 4.538 | $ | 10,064 | $ | 6,903 | ||||||||
| Adjusted Gross Profit % | 90.8 | % | 90.3 | % | 90.3 | % | 87.8 | % | ||||||||
| Service | ||||||||||||||||
| Revenue | 17,885 | 11,847 | 34,491 | 21,405 | ||||||||||||
| Cost of goods sold | (8,262 | ) | (4,725 | ) | (15,925 | ) | (8,667 | ) | ||||||||
| Gross profit | $ | 9,623 | $ | 7,122 | $ | 18,566 | $ | 12,738 | ||||||||
| Gross profit margin | 53.8 | % | 60.1 | % | 53.8 | % | 59.5 | % | ||||||||
| Less: | ||||||||||||||||
| Depreciation charges | 591 | 472 | 1,282 | 932 | ||||||||||||
| Share-based compensation expenses | 76 | - | 89 | - | ||||||||||||
| Adjusted Gross Profit | $ | 10,290 | $ | 7,594 | $ | 19,937 | $ | 13,670 | ||||||||
| Adjusted Gross Profit % | 57.5 | % | 64.1 | % | 57.8 | % | 63.9 | % | ||||||||
| Corporate / Unallocated | ||||||||||||||||
| Revenue | 2,483 | 816 | 4,560 | 2,045 | ||||||||||||
| Cost of goods sold | (1,361 | ) | (466 | ) | (2,455 | ) | (935 | ) | ||||||||
| Gross profit | $ | 1,122 | $ | 350 | $ | 2,105 | $ | 1,110 | ||||||||
| Gross profit margin | 45.2 | % | 42.9 | % | 46.2 | % | 54.3 | % | ||||||||
| Less: | ||||||||||||||||
| Depreciation charges | - | 5 | - | 15 | ||||||||||||
| Share-based compensation expenses | - | - | - | - | ||||||||||||
| Adjusted Gross Profit | $ | 1,122 | $ | 355 | $ | 2,105 | $ | 1,125 | ||||||||
| Adjusted Gross Profit % | 45.2 | % | 43.6 | % | 46.2 | % | 55.0 | % | ||||||||
Exhibit 99.3

August 11, 2022 Olink Proteomics Vision Enable understanding of real - time human biology Mission Accelerate proteomics together

Disclaimer This presentation may contain certain forward - looking statements and opinions . Forward - looking statements are statements that do not relate to historical facts and events and such statements and opinions pertaining to the future that, for example, contain wording such as “may,” “might,” “will,” “could,” “would,” “should,” “expect,” “intend,” “plan,” “objective,” “anticipate,” “believe,” “estimate,” “predict,” “potential,” “continue,” “ongoing,” or the negative of these terms, or other comparable terminology intended to identify statements about the future . Forward - looking statements contained in this presentation include, but are not limited to, statements about : our addressable market, market growth, future revenue, key performance indicators, expenses, capital requirements and our needs for additional financing, our commercial launch plans, our strategic plans for our business and products, market acceptance of our products, our competitive position and developments and projections relating to our competitors, domestic and foreign regulatory approvals, third - party manufacturers and suppliers, our intellectual property, the potential effects of government regulation and local, regional and national and international economic conditions and events affecting our business . We cannot assure that the forward - looking statements in this presentation will prove to be accurate . Furthermore, if our forward - looking statements prove to be inaccurate, the inaccuracy may be material . These statements involve known and unknown risks, uncertainties and other important factors that may cause our actual results, levels of activity, performance or achievements to be materially different from the information expressed or implied by these forward - looking statements . The forward - looking statements and opinions contained in this presentation are based on our management’s beliefs and assumptions and are based upon information currently available to our management as of the date of this presentation and, while we believe such information forms a reasonable basis for such statements, such information may be limited or incomplete, and our statements should not be read to indicate that we have conducted an exhaustive inquiry into, or review of, all potentially available relevant information . In light of the significant uncertainties in these forward - looking statements, you should not regard these statements as a representation or warranty by us or any other person that we will achieve our objectives and plans in any specified time frame, or at all . Actual results, performance or events may differ materially from those in such statements due to, without limitation, risks generally associated with product development, including delays or challenges that may arise in the development, launch or scaling of our new products, programs or services, challenges in the commercialization of our products and services, the risk that we may not maintain our existing relationships with suppliers or enter into new ones, or that we will not realize the intended benefits from such relationships, any inability to protect our intellectual property effectively, changes in general economic conditions, in particular economic conditions in the markets on which we operate, changes affecting interest rate levels, changes affecting currency exchange rates, changes in competition levels, and changes in laws and regulations, and other risks described under the caption "Risk Factors" in our Form 20 - F (Commission file number 001 - 40277 ) and elsewhere in the documents we file with the Securities and Exchange Commission from time to time . The information, opinions ad forward - looking statements contained in this announcement speak only as of its date, and are subject to change without notice and we undertake no obligation to update any such forward - looking statements for any reason, except as required by law . This presentation contains estimates, projections and other information concerning our industry, our business, and the markets for our products and services . Information that is based on estimates, forecasts, projections, market research or similar methodologies is inherently subject to uncertainties, and actual events or circumstances may differ materially from events and circumstances that are assumed in this information . Unless otherwise expressly stated, we obtained this industry, business, market and other data from our own internal estimates and research as well as from reports, research surveys, studies and similar data prepared by market research firms and other third parties, industry, medical and general publications, government data and similar sources . While we believe our internal company research as to such matters is reliable and the market definitions are appropriate, neither such research nor these definitions have been verified by any independent source . 2

Olink at a glance Company profile • Swedish proteomics company founded in 2016 active in protein biomarker discovery and development • Market leader with a unique proprietary technology, Proximity Extension Assay (PEA), with strong IP utilizing NGS and qPCR for readout − Agnostic to NGS and qPCR platforms • 516 employees with 186 on the commercial team • Strong commercial execution with KOLs, academia, and biopharma through a global direct sales force • Offers distributed kits and fee - for - service 2Q 2022 momentum and recent highlights − Continued strong execution on all strategic value drivers − Revenue growth 56% YoY, with ~26% of total from reagent kits − Strength from hi - plex to low - plex − Data from UKB - PPP, and others, defining Olink’s promise in proteomics − Explore was ~67% of revenues with ~24% generated from reagent kits − 29 Explore customer installations with ~$700K LTM average revenue pull - through per customer − 51 Signature installations at end of quarter − Excellent progress towards a return to profitability Market opportunity • $35B TAM for research and clinical applications − High - plex: 1,000s of proteins in 1,000s of samples − Mid - plex: 10 - 100s of proteins in 1,000s of samples − Low - plex and Dx: 5 - 10 proteins • Targeting ~5k NGS systems for high - plex • Targeting ~4k mid - plex proteomics labs • Clinical decision making Ambition and growth strategy • Aim for #1 market share in the emerging field of proteomics and establish NPX as the gold standard in proteomics • Continue to drive PEA in clinical decision making • Library expansion: 4.5k to 6k and beyond • Continue unlocking the mid - plex market with Signature and FlexPlex • Customer internalization through a distributed kits model • Scaling up the organization to accelerate growth • Invest in R&D to maximize the potential of the platform 3
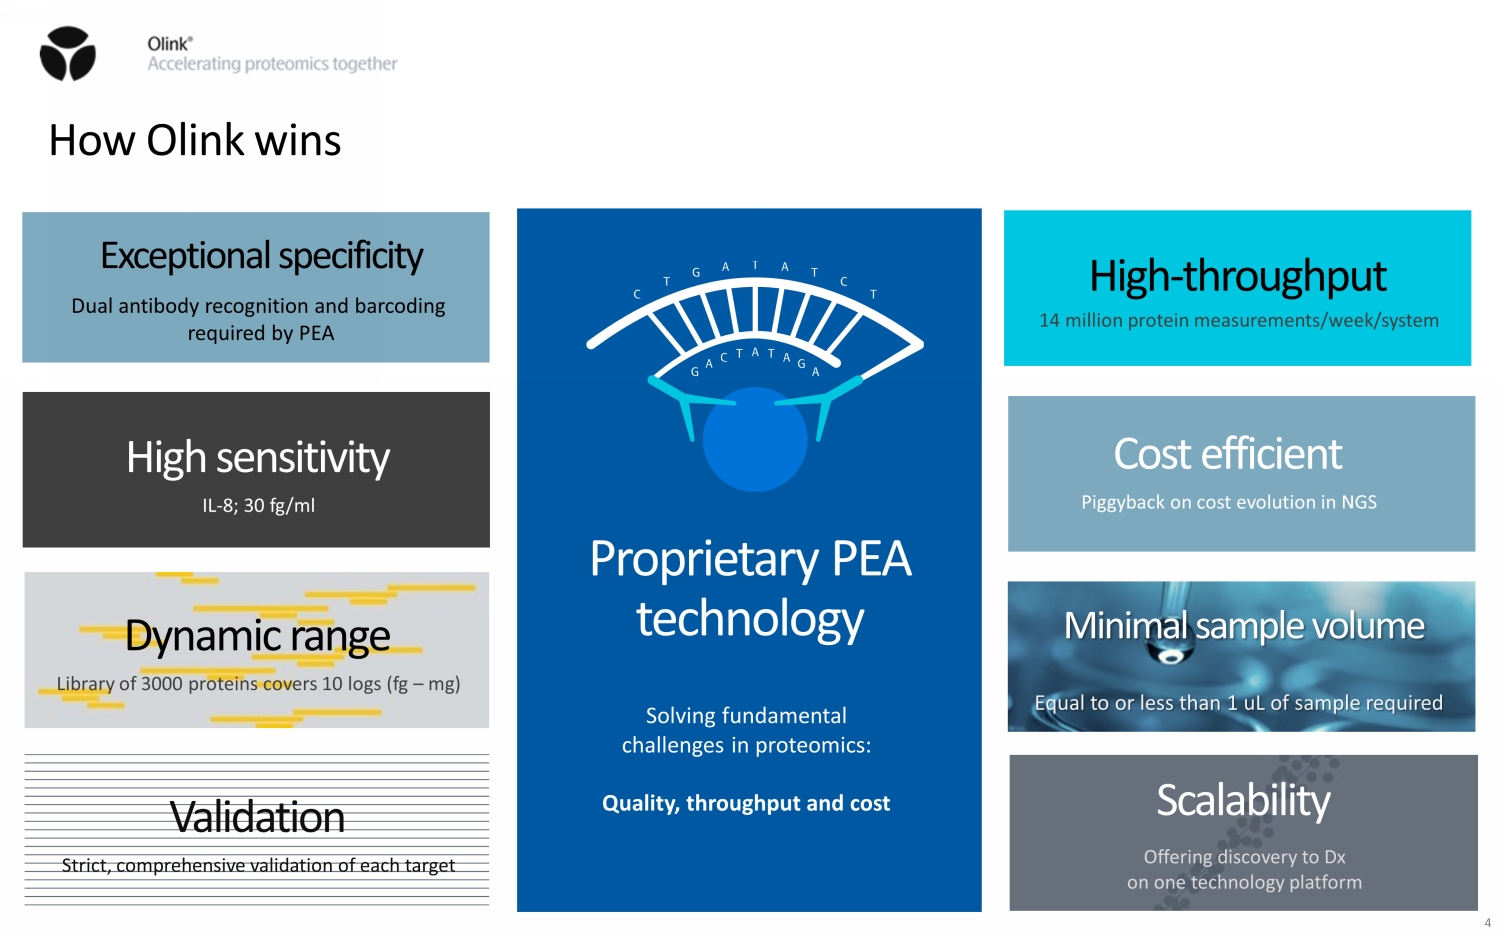
4 How Olink wins 4 Dynamic range Library of 3000 proteins covers 10 logs (fg – mg) Validation Strict, comprehensive validation of each target High - throughput 14 million protein measurements/week/system Cost efficient Piggyback on cost evolution in NGS Scalability Offering discovery to Dx on one technology platform High sensitivity IL - 8; 30 fg/ml Proprietary PEA technology Solving fundamental challenges in proteomics: Quality, throughput and cost Dual antibody recognition and barcoding required by PEA Exceptional specificity Minimal sample volume Equal to or less than 1 uL of sample required 4

Focus Forming the basis of our Dx offering Custom developed for each client/use case First LDT by Octave Bioscience to monitor disease management / progression in multiple sclerosis (MS) Octave is preparing for early use of the MSDA in select MS centers over the course of the year Explore Measure ~3k proteins with minimal biological sample. Aggressively expand our protein biomarker targets to meet every customer need across all proteomics use cases. Explore 384 Minute sample volume, <1µl, and outstanding throughput, 14 M measurements per week/system Explore kit launched in 2021 Target 96 Choose from fifteen carefully designed panels built for specific area of disease or key biology process Target 48 Introducing our 48 - plex Cytokine panel with absolute quantification Signature Light and nimble benchtop system purpose built for PEA. Began deliveries and revenue recognition in 4Q 2021 Aggressive expansion of product portfolio and offering Unique and holistic product offering applicable from discovery to Dx 5

Break - through science with Olink in high - impact peer reviewed literature Across every major therapeutic area 6

Enabling the proteomics conversation in 2022 7 UK Biobank Pharma Proteomics Project Explore is helping find proteins that matter • Genetic atlas of the plasma proteome providing the scientific community an open - access proteomics resource • Pioneering early results in June 2022 on bioRxiv • Genetic regulation of the human plasma proteome in 54,306 UK Biobank participants • Explore 1536 and genome sequencing on 54,306 UK Biobank participants • pQTL mapping of 1,463 proteins identifying 10,248 primary genetic associations • Strengths of Olink’s Explore for pQTL detection and downstream biological discovery • A high proportion, 82%, of the proteins tested had cis associations, evidence of Olink’s highly specific assays • Full data set expected by the end of 2022 • Published using Olink's unit of protein expression, NPX (Normalized Protein eXpression)

Singapore Shanghai Boston Tokyo Uppsala Leading execution, delivering on all strategic levers 56% Year over year revenue growth in 2Q22 (unaudited) ~67% Explore revenues share of 2Q22 total revenues Top 20 Served all 20 of the largest biopharma 100% Coverage of the plasma proteome using Explore 3072 ~4k Untapped base of proteomics labs addressable by Olink 8 >5k Untapped base of Illumina NGS systems addressable by Olink ~26% Reagent kit share of 2Q22 total revenues

Singapore Shanghai Boston Tokyo Uppsala Strong execution of externalizations with significant headroom to grow 29 Explore customer installations 1 12 6 APAC 13 9 17 EMEA 15 30 17 Americas Explore labs Biomark core labs Signature labs 51 Cumulative Signature placements at end of 2Q22 9 68% Explore revenues share of LTM total revenues ~640K Sample potential on Explore externalizations 26% Kits revenue share of LTM total revenues 40 Olink Biomark core labs ~$700k LTM Explore average revenue pull - through per customer installation

10 Proprietary PEA technology Discovery to Dx Proximity Extension Assay (PEA) Solving fundamental challenges in proteomics $35bn TAM opportunity A market leader Strong commercial execution Market leader with a differentiated technology platform enabling customers from Discovery to Dx 10
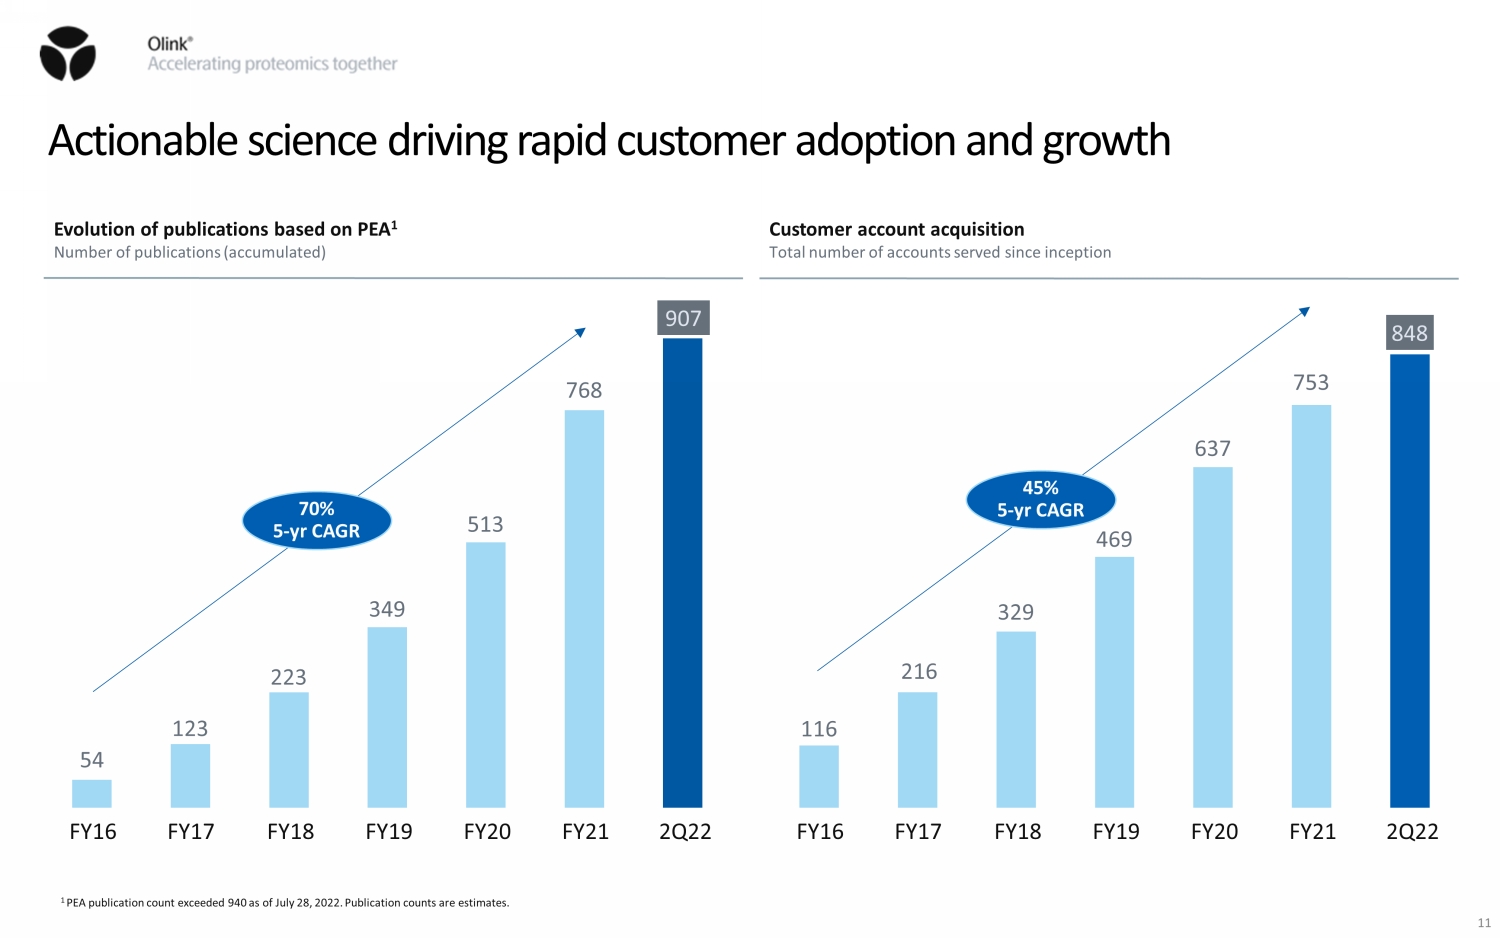
Actionable science driving rapid customer adoption and growth Evolution of publications based on PEA 1 Number of publications (accumulated) 54 123 223 349 513 768 907 FY17 FY16 FY20 FY19 FY18 FY21 Customer account acquisition Total number of accounts served since inception 2Q22 116 216 329 469 637 753 848 FY17 FY16 FY20 FY19 FY18 FY21 2Q22 70% 5 - yr CAGR 45% 5 - yr CAGR 1 PEA publication count exceeded 940 as of July 28, 2022. Publication counts are estimates. 11

Second quarter financial results (unaudited) 12 1. Adjusted EBITDA is a non - IFRS measure and defined as profit for the year before accounting for finance income, finance costs, tax, depreciation, and amortization of acquisition intangibles, further adjusted for management adjustments and share based c om pensation expenses. Refer to Appendix for non - IFRS reconciliation. 2. Adjusted Gross Profit is a non - IFRS measure and defined as revenue less cost of goods sold, which is then adjusted to remove the impact of depreciation and the impact of material transactions or events that we believe are not indicative of our core opera ti ng performance, such as share based compensation expenses. Refer to Appendix for non - IFRS reconciliation. 2Q 2021 2Q 2022 Total revenue $ 17.7 $ 27.5 Total EBITDA ($ 7.7) ($ 10.2) Total adjusted EBITDA 1 ($ 6.3) ($ 7.9) Gross profit (%) 67.1 % 62.0 % Adjusted gross profit (%) 2 70.6 % 65.1 % 65% 26% 9% Service Kit Other Segment breakdown % of total Headcount development #Headcount Financial highlights USDM 70 71 106 135 214 416 516 FY16 FY17 FY19 FY18 FY20 FY21 2Q22

Second quarter 2022 revenue (unaudited) 13 1. RoW includes Japan and RoW. 2. EMEA includes Sweden. $27.5 million in revenue for 2Q 2022, representing 56% YoY growth on a reported basis Revenue by segment USD’000 Revenue by geography USD’000 5,025 11,847 816 7,146 17,885 2,483 Other Kit Service +42% +204% 2Q21 2Q22 7,776 8,521 1,391 12,531 12,573 2,410 China & RoW (1) Americas EMEA (2) +61% +48% +73% 2Q21 2Q22 Explore accounted for 67% of revenue in 2Q 2022, with Y/Y service segment and kit segment growth of 51% and 42%, respectively +51%

Second quarter 2022 adjusted gross profit percentage (unaudited) 14 1. Adjusted Gross Profit is a non - IFRS measure and defined as revenue less cost of goods sold, which is then adjusted to remove the impact of depreciation and the impact of material transactions or events that we believe are not indicative of our core opera ti ng performance, such as share based compensation expenses. Refer to Appendix for non - IFRS reconciliation. $17.9 million in adjusted gross profit for 2Q 2022, compared to $12.5 million in 2Q 2021 Adjusted gross profit percentage was 65.1% in 2Q 2022, reflecting investments into our service to continue buildout of lab ca pac ity and deliveries to UKB - PPP Adjusted gross profit percentage by segment 1 USD’000 90% 64% 44% 91% 58% 45% Kit Other Service 2Q21 2Q22 Reported GM 87% Reported GM 89% Reported GM 60% Reported GM 54% Reported GM 43% Reported GM 45%

Second quarter 2022 operating expenses (unaudited) $31.7 million in total operating expenses for 2Q 2022, compared to $23.3 million in 2Q 2021 1 Olink is investing according to its strategic plan, hiring in the commercial and R&D teams, while expecting a return to profitability for FY23 Selling expenses USD’000 6,979 10,588 2Q21 Research and development expenses USD’000 4,990 7,333 2Q21 2Q22 General and administrative expenses USD’000 12,172 13,994 2Q22 2Q21 1. Total operating expenses includes Other operating income/(loss) . 2Q22 15

Constant currency revenue growth of 62% vs reported revenue growth of 56% FX impact driven by strengthening of the USD against the EUR, SEK and GBP Currency rates from Olink ERP system, sourced from the Swedish Riksbank 2Q 2022 revenues by currency MUSD FX rate change 2Q22 on 2Q21 Index rebased at 100 with 2Q21 as base year 19.8 0.4 4.1 1.8 1Q22 GBP 1.3 0.1 USD EUR SEK CNY JPN 27.5 Comments Generated 72% of revenues in USD in 2Q22. Currency flows largely stem from business activities in the Americas, but there are USD paying customers in other regions as well. Other key currencies are EUR, SEK, and GBP stemming from customer transactions in EMEA. In 2Q22 we saw a continued strengthening of the USD against most key currencies, leading to a currency headwind compared to prior year (as set out opposite) and against the FX rates used for internal planning. 100 100 100 100 100 100 100 88 86 90 98 84 USD EUR SEK GBP JPY CNY - 12% - 14% - 10% - 2% - 16% 2Q21 2Q22 16

2022 guidance – expecting rapid growth We expect full - year 2022 revenue to be in the range of $138M and $145M, representing 45% to 53% growth over 2021 We expect strong sustainable growth, and continued investment into our organization 2022 revenue guidance USDM 46 54 95 138 - 145 FY19 FY20 FY21 FY22 +17% +76% +45 - 53% 17

18 Olink management team and organization Jon Heimer Chief Executive Officer Oskar Hjelm Chief Financial Officer Rickard EI Tarzi Chief Strategy Officer Ida Grundberg, PhD Chief Scientific Officer Carl Raimond Chief Commercial Officer Fredrik Netzel Chief Operating Officer Linda Ramirez - Eaves General Counsel Management team Overview of the Olink organization in 2022 Johanna Isander Chief People Officer >516 Employees worldwide >186 Employees on the commercial team >178 Employees in R&D 18

A complete picture of real - time human biology Genomics Proteomics Epigenomics Transcriptomics Metabolomics Accelerating proteomics together Our mission Enable understanding of real - time human biology Our vision

Non - IFRS reconciliations 20

Non - IFRS reconciliation (constant currency revenue growth) 21 ($ in thousands) Three months ended June 30, 2022 Three months ended June 30, 2021 Revenue $ 27,514 $ 17,688 Revenue growth (IFRS) 56 % Foreign exchange impact - 6 % Constant currency revenue growth 62 % We use the non - IFRS measure of constant currency growth, which we define as our total revenue growth from one fiscal year to the next on a constant currency exchange rate basis. We measure our constant currency revenue growth by applying the current fiscal period’s average exchange rate to the prior ye ar fiscal period.

Non - IFRS reconciliation (adjusted gross profit) ($ in thousands) Three months ended June 30, 2022 Three months ended June 30, 2021 Gross profit $ 17,070 $ 11,865 Gross profit % 62.0% 67.1% Less: Depreciation charges $ 727 $ 622 SBC expenses $ 103 - Adjusted gross profit $ 17,900 $ 12,487 Adjusted gross profit % 65.1% 70.6% 22

Non - IFRS reconciliation (adjusted EBITDA) ($ in thousands) Three months ended June 30, 2022 Three months ended June 30, 2021 Operating profit (loss) $ (14,606) $ (11,408) Add: Amortization $ 2,847 $ 2,728 Depreciation $ 1,510 $ 1,029 EBITDA $ (10,249) $ (7,651) Management adjustments $ 321 $ 1,400 SBC expenses $ 1,992 - Adjusted EBITDA $ (7,936) $ (6,251) 23

Non - IFRS reconciliation (adjusted gross profit) ($ in thousands) Three months ended June 30, 2022 Three months ended June 30, 2021 Gross profit $ 6,325 $ 4,393 Gross profit % 88.5% 87.4% Less: Depreciation charges $ 136 $ 145 SBC expenses $ 27 - Adjusted gross profit $ 6,488 $ 4,538 Adjusted gross profit % 90.8% 90.3% Three months ended June 30, 2022 Three months ended June 30, 2021 $ 9,623 $ 7,122 53.8% 60.1% $ 591 $ 472 $ 76 - $ 10,290 $ 7,594 57.5% 64.1% Three months ended June 30, 2022 Three months ended June 30, 2021 $ 1,122 $ 350 45.2% 42.9% - $ 5 - - $ 1,122 $ 355 45.2% 43.6% Kits revenue Service revenue Other revenue 24